
TL;DR
- Problem: integrations between vendor tools and co‑managed IT often fail due to auth, schema, or network issues; preserve evidence for NYDFS/HIPAA review.
- Quick answer: follow a detect → isolate → notify → escalate triage matrix, run standard checks (ping, curl, API token introspection), then escalate per your SLA.
- If you need senior‑engineer help, review Eighty Seven Solutions our services or our services pages.

If a monitoring feed, backup connector, or ticketing webhook suddenly stops delivering data, you face lost visibility and compliance risk. Vendor tool integration troubleshooting co-managed IT is about finding which part of the chain failed — the vendor, the MSP, or your in‑house controls — and fixing it fast. This guide gives practical checks, commands, escalation rules for NJ & NY businesses, and clear artifacts you can copy into runbooks.
Overview — common integration failures in co‑managed setups
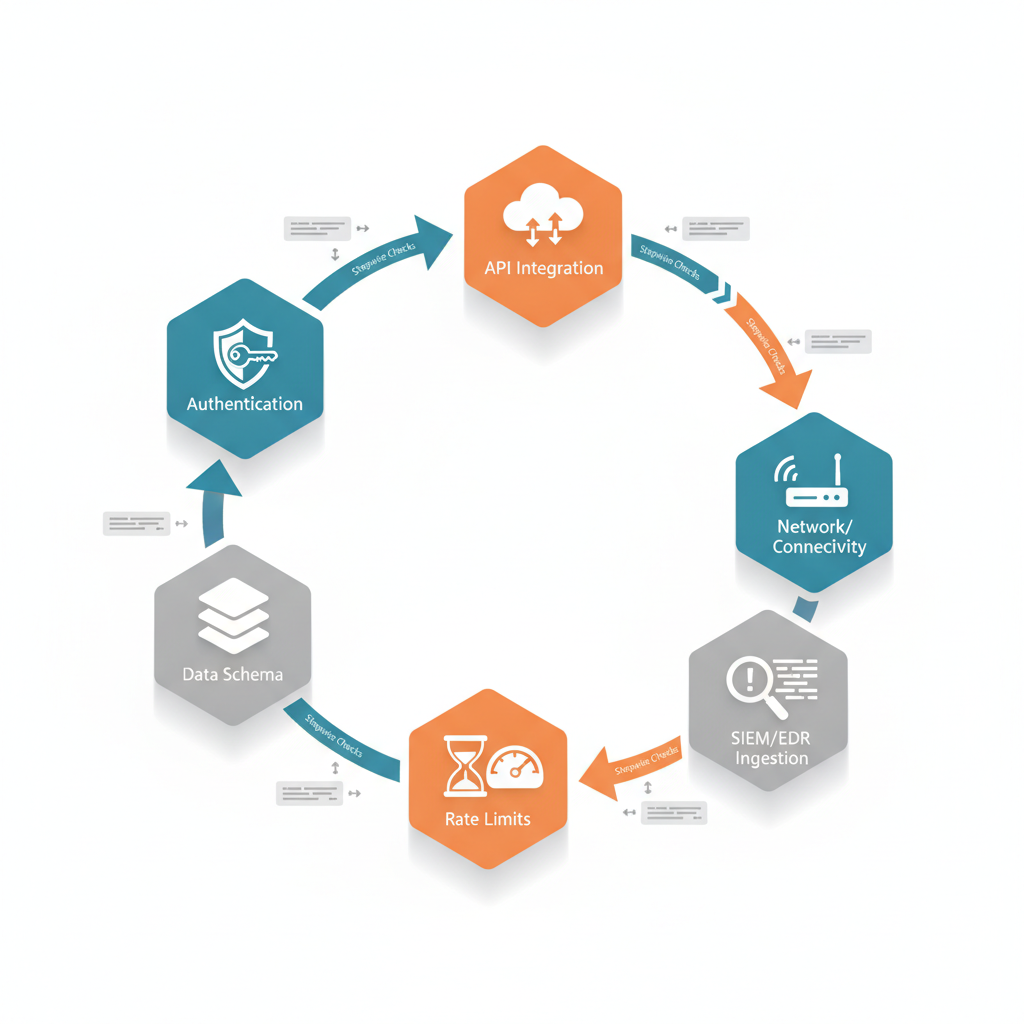
Without reliable integrations, co‑managed IT breaks down: tickets don’t sync, EDR alerts stop flowing into SIEM, backups show incomplete snapshots. Typical failures fall into three buckets: authentication and permission errors, data ingestion and schema mismatches, and network/connectivity issues. For example, a ticketing connector that used a service account may break when that account’s password rotates or when the vendor changes OAuth scopes. Another common scenario: a SIEM parser stops processing logs after a vendor changes JSON keys, causing high‑severity events to be missed.
These failures affect both operational uptime and regulatory posture for NJ and NY SMBs. A disconnected EDR feed during an incident can create evidentiary gaps for NYDFS examinations or HIPAA breach reviews. Practical evidence: always capture raw API responses and timestamps when troubleshooting — that preserves chain‑of‑custody metadata needed for audits. For businesses navigating these challenges, understanding co-managed and hybrid IT models can be crucial.
Quick triage flow for integration incidents
Start with a rapid triage to contain impact and collect evidence. Use this concise triage matrix as a working rule: detect → isolate → notify → escalate. Detect: confirm failure with monitoring dashboards and sample API calls. Isolate: stop automated retries and route alerts to a human queue to avoid noise. Notify: alert the compliance officer and system owner (for NY regulated orgs, notify the information security officer and legal counsel if data may be exposed). Escalate: if the cause is a vendor API or product defect, escalate to the vendor; if the connector is managed by the MSP, escalate to the MSP senior engineer.
Example (NJ manufacturing): a webhook from an industrial control vendor stops posting to your PSA. Detect by comparing vendor delivery logs to your PSA ingestion logs. Isolate by disabling the webhook and switching to a manual backup ingest while you investigate. Notify the plant IT lead and compliance officer. Escalate to the vendor if the vendor delivery shows 2xx responses but the PSA rejects payloads.
Log the raw API request and response — timestamps and headers are forensic evidence.
Authentication & permission errors
Authentication failures are the top cause of connector outages. Common mistakes include expired OAuth refresh tokens, service account password rotation, missing scopes, or conditional access policies blocking vendor IPs. Check the following in order: token validity, scope coverage, service account status, and conditional access logs. Example commands: for OAuth APIs use curl -i -H "Authorization: Bearer <token>" https://api.vendor.example/health to validate token acceptance and inspect headers for scope errors. For Active Directory service accounts, verify account status and lastPasswordSet attribute.
Remediation steps: renew tokens, reauthorize scopes, or create a constrained service principal with explicit permissions. For co‑managed setups, ensure both MSP and in‑house maintain a documented change window for any auth credential rotation to avoid unexpected lockouts.
Data ingestion and schema mismatches
When parsers expect a field that was renamed or data types differ, ingestion pipelines drop or misclassify events. A practical check is to capture a sample payload from the vendor and run it through your parser locally. Use a JSON validator and compare keys. Example: if your SIEM expects user.email but the vendor now sends account.primaryEmail, map fields in the ingestion transformation or update parsers.
Concrete thresholds: for typical log pipelines aim for P95 parsing success > 99% and queue depth under 5,000 messages. If parsing success drops, flag it as a high‑priority incident. Maintain a mapping table in your runbook that lists expected fields, versions, and last confirmed date to reduce time to repair.
Network/connectivity and firewall issues
Blocked IPs, DNS changes, and MTU mismatches can break integrations. Start with basic network checks: ping vendor.example, traceroute vendor.example, and nslookup. If HTTPS connections fail, run curl -v https://api.vendor.example/health to inspect TLS and certificate chains. On firewalls, verify egress rules allow vendor IP ranges and destination ports (often 443). If a vendor uses dynamic IP ranges, prefer DNS names and validate SNI handling on your proxy.
Example: an MSP-managed edge firewall update inadvertently blocked egress to vendor feed IPs during a maintenance window; the fix was to add vendor FQDNs to the allowlist and enable logging of dropped packets for 48 hours to confirm no further blocks.
Stepwise troubleshooting recipes (with commands/checks where applicable)
Follow a reproducible recipe to reduce guesswork. Step 1: confirm the failure with monitoring dashboards and retrieve the last successful timestamp. Step 2: run network checks (ping, traceroute, curl -v). Step 3: validate auth (curl -H "Authorization: Bearer <token>"), inspect 401 vs 403 vs 429 responses. Step 4: fetch a sample payload and run local parsing. Step 5: check vendor status pages and vendor change logs.
Commands example pack:
ping api.vendor.example
traceroute api.vendor.example
curl -v -H "Authorization: Bearer $TOKEN" https://api.vendor.example/health
jq '.' sample_payload.jsonAlways include timestamps in UTC and the full raw request/response when opening vendor tickets.
SIEM/EDR ingestion troubleshooting
For SIEM/EDR pipelines, verify connector health panels and event counts first. If EDR events stop arriving, check the agent policy deployment and agent‑to‑cloud connectivity. Pull a 24‑hour event differential: if event volume drops sharply, inspect for agent misconfiguration, quarantine, or API quota exhaustion at the vendor. For SIEM parsers, enable debug logging on one pipeline instance to replay events and find parsing errors.
Example: an EDR feed showed normal agent check‑ins but zero alerts forwarded to SIEM because the forwarding rule had been disabled during tuning. Re‑enable forwarding and validate by forcing a harmless test alert; document the test in your runbook.
API rate limits and token refresh debugging
403/429 responses often indicate rate limits or expired tokens. Check response headers for rate limit headers like X-RateLimit-Remaining or vendor‑specific fields. Implement exponential backoff and ensure refresh tokens are rotated before expiry. Debugging steps: inspect auth server logs for refresh failures, validate clock skew between client and server (NTP), and simulate token refresh using the vendor's token endpoint.
Concrete rule: if you hit rate limits more than twice in 24 hours, throttle upstream collectors and contact us to request a higher quota or architectural change (batching, event filters). For co-managed environments, coordinate quota increases during a scheduled change window so both MSP and in-house teams can validate.
When to escalate to vendor vs MSP vs in‑house
Escalate to the party responsible for the failing component. If the vendor’s API returns 5xx errors or their status page shows an incident, escalate to the vendor. If the connector code, firewall, or credential management is handled by the MSP, escalate internally to the MSP senior engineer. If the issue involves in‑house policies (conditional access, local agent misconfiguration), escalate to the internal IT owner.
Decision rule: if the failure reproduces with a direct curl from your network to the vendor and returns valid 2xx but your pipeline still drops data, the issue lives in the MSP/in‑house transformation layer. If the vendor’s logs show failed deliveries or schema changes, escalate to the vendor. Keep a written record of the escalation path and SLA expectations.
Escalation matrix and SLA impact
Create an escalation matrix that maps failure type to owner, contact, and SLA window. Example matrix rows: authentication (owner: MSP, SLA: 4 hours), vendor API outage (owner: vendor, SLA: vendor published), data schema change (owner: in‑house/MSP, SLA: 8 hours). Include secondary contacts and communication channels (email, phone, vendor portal ticket ID).
SLA impact: missing critical alerts counts as high severity and should trigger the fastest escalation path. Document expected response times in your runbook and measure mean time to detect (MTTD) and mean time to repair (MTTR) monthly to find systemic problems.
Permanent fixes and hardening after root cause analysis
Once you identify root cause, harden the integration to prevent recurrence. Typical fixes: implement token rotation automation, add schema version checks, move parsing to a more resilient platform, or add retry queues with dead‑letter handling. Example: add a nightly validation job that fetches a vendor sample and runs it through parsers; if the job fails, create a paging alert.
Concrete thresholds: require parsing success ≥ 99.5% and automated alerting when success drops below 99%. For auth, enforce token refresh 24 hours before expiry to avoid edge cases from clock skew or transient errors.
Automation tests, monitoring alerts, and runbook updates
Add synthetic transactions and automated smoke tests that run every 5–15 minutes. Monitor for metric drops and add clear runbook steps. Update runbooks with exact commands, file paths, and escalation contacts. Example runbook entry: how to rotate a service account, re‑provision scopes, and validate end‑to‑end with a synthetic event. Store runbooks in version control and require a post‑incident review to update them.
Post‑incident compliance evidence collection
Collect and preserve artifacts that regulators may request: raw API request/response logs, timestamps in UTC, affected user lists, backup snapshots, and chain‑of‑custody notes. For NYDFS regulated entities, document detection time, isolation actions, and notifications to the board or regulators. For HIPAA, document protected health information exposure assessment and mitigation steps. Store evidence in immutable logs or WORM storage where possible.
Example: if an EDR feed outage overlaps with a suspected compromise, export the vendor's raw event archive and keep an MD5 checksum of the archive file for future review. Label all items with incident ID and retain per your retention policy.
Appendix — sample runbooks and debugging checklist
Below are reusable artifacts you can copy into your operations folder.
Tool integration checklist (copyable)
- Confirm last successful timestamp and sample payload
- Run network checks: ping, traceroute, curl -v
- Validate auth: token introspection and scope checks
- Parse sample payload locally and compare schema
- Check vendor status page and change logs
- Collect artifacts: raw request/response, headers, logs
- Open ticket with vendor/MSP including UTC timestamps and reproduction steps
Decision matrix
| Observed symptom | Primary owner | Immediate action |
|---|---|---|
| 401/403 from API | MSP/in‑house | Validate token, reauthorize, rotate credential |
| 5xx from vendor | Vendor | Check vendor status, open vendor incident |
| Parsing errors | MSP | Replay payload, update parser mapping |
FAQ
What is troubleshooting vendor & tool integration issues in co-managed IT? For more on this, see Co-managed it vendor integration checklist.
Troubleshooting vendor & tool integration issues in co‑managed IT is the process of identifying and resolving failures across authentication, data ingestion, network, and API layers that prevent vendor tools from communicating reliably with co‑managed systems.
How does troubleshooting vendor & tool integration issues in co-managed IT work?
It follows a structured approach: detect the failure, isolate the affected components, notify stakeholders (including compliance for NY/NJ regulated firms), collect forensic artifacts, apply targeted fixes, and update runbooks to harden the integration.
References
- Troubleshooting Intune and Configuration Manager co-management workloads — Microsoft Learn
- ConnectWise PSA inspector fails to push data — Liongard Support
- PSA and ITSM integrations for ticketing — N‑able documentation
- #StopRansomware Guide — CISA