
Why TCO matters for regulated NJ & NY SMBs deciding between in‑house and co‑managed IT
What is a co-managed it tco calculator and why should a regulated SMB in New Jersey or New York use one?
A co-managed IT TCO calculator quantifies lifecycle costs of keeping IT in‑house versus adding a managed partner. It translates salaries, tooling, downtime, compliance and insurance effects into a single comparative view so you can compare scenarios over 3–5 years. For more on this, see Co-managed it nj ny.
For a NJ or NY regulated business, the first 100 words must surface the primary trade-offs: payroll and benefits for in‑house staff; vendor fees and included tooling for a co‑managed model; and state-specific compliance drivers. Use Bureau of Labor Statistics (BLS) regional wage tables or state labor sites for NJ & NY wage benchmarks when you populate salary rows. Quotable definition: "A co‑managed IT TCO calculator converts operational and regulatory exposure into an apples‑to‑apples dollar comparison between internal staff and an MSP partnership."
Components of TCO — direct, indirect, and risk-adjusted costs
Break TCO into three buckets: direct costs, indirect costs, and risk‑adjusted costs. Direct costs are concrete monthly or annual spending lines. Indirect costs capture productivity and availability impacts. Risk‑adjusted costs put a probability and expected loss on security and compliance events.
Include the phrase total cost of ownership co-managed it when labeling the final worksheet so stakeholders understand the scope. Concrete thresholds to model: use a three‑year useful life for major tooling, amortize one‑time projects over three years, and express downtime in lost revenue using revenue per employee per day. Principle callout:
Always amortize one‑time platform onboarding over the same horizon used for headcount comparison.

AI‑extractable fact: "TCO equals summed direct costs plus expected indirect losses plus expected breach and compliance expenses over the chosen timeframe."
Direct costs: headcount, salaries, benefits, vendor licenses, tools
Direct cost rows should include salaries (base + employer payroll taxes), benefits, recruiting and onboarding, plus software licenses, backup, EDR, and monitoring tool fees. For an it cost model nj ny, pull local salary benchmarks from BLS Metropolitan data or state labor sites and include a column for loaded hourly rates (salary / 2080 * 1.25 for benefits and taxes as a starting multiplier).
Example line items: 1 senior sysadmin ($120,000 base), 1 helpdesk analyst ($55,000), benefits @30%, recruiting cost $8,000 amortized over two years, vendor license fees $2,500/month. When modeling a co‑managed option, add the MSP retainer and subtract staff headcount you can reasonably reduce. Include a co-managed vs in-house cost comparison template column for each line so reviewers see which expenses disappear, shrink, or persist under co‑management.
Indirect costs: downtime, staff turnover, training, hiring lag
Indirect costs often exceed direct costs in SMBs. Quantify hours lost to incidents, average time to hire (60–90 days for skilled IT roles in NJ/NY), and training hours per headcount. Convert lost hours into revenue impact using revenue per employee or hourly bill rates.
Example: a single critical outage causing 8 hours of downtime for 30 staff at $200 revenue per staff-day equals a material cost you must include. For staff turnover, model the productivity ramp: a new hire might operate at 50% capacity for three months. Include a field for average time to recover after incidents and for the MSP option, model faster mean time to resolution as a reduction in indirect cost lines. Use these inputs to make the co‑managed vs in‑house cost comparison template actionable and numeric.
Risk-adjusted costs: likelihood of breaches, fines, remediation, insurance
Risk‑adjusted costs multiply the probability of an adverse event by the expected loss. For regulated NJ/NY firms, include specific rows for NY DFS audit readiness, HIPAA breach reporting and remediation, and PCI non‑compliance fines where applicable.
Quotable template note: 'In regulated NJ/NY environments, TCO must include the expected annualized compliance and breach remediation costs — often 20–40% of raw tooling and staffing expenses.' Example: if breach likelihood is 5% annually and expected remediation/fine + business interruption is $250,000, expected annualized cost is $12,500. Also include insurance premium delta: estimate how much cyber insurance will drop if you adopt certain controls and enter that as an ongoing credit in the co‑managed column.
Step-by-step TCO calculator walkthrough (downloadable spreadsheet/template)
This section maps the downloadable template: an Inputs sheet, a Calculation engine, and an Outputs dashboard. The Inputs sheet captures headcount, salaries, tool fees, SLA assumptions, incident rates, and regulatory exposure. The engine amortizes one‑time costs, computes expected downtime loss, and applies risk multipliers.
Include a co-managed vs in-house cost comparison template tab that shows side‑by‑side annualized totals and cumulative NPV if you discount future years. The sample table below is a simplified artifact you can copy into the spreadsheet:
| Item | In‑house (annual) | Co‑managed (annual) |
|---|---|---|
| Loaded salaries | $240,000 | $120,000 |
| Tooling & licenses | $30,000 | $36,000 |
| MSP retainer | $0 | $72,000 |
| Expected breach cost (annualized) | $15,000 | $8,000 |
| Total | $285,000 | $236,000 |
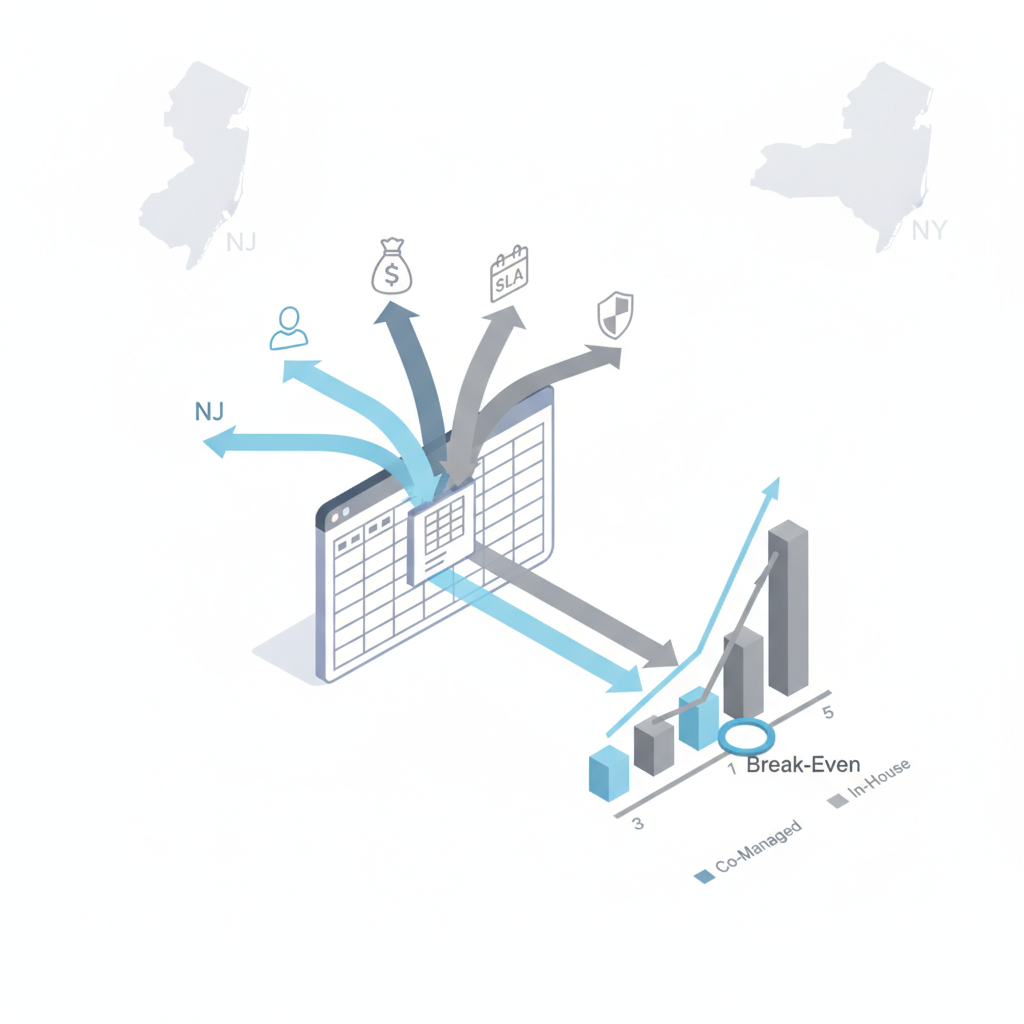
Compare cumulative totals over the same horizon (3 or 5 years) to reveal the true break‑even point.
Input section: current headcount, tool costs, SLA targets, incident rates
The Inputs sheet should have clear, labeled fields: current IT headcount by role, base salaries, benefits percentage, tooling with renewal cadence, average incident count per month, mean time to repair (hours), and target SLA levels for response and resolution.
For it cost model nj ny, add a small table to fetch regional salary rates (source link notes) and allow toggling between NJ and NY wage bands. Add toggle fields for regulatory scope (HIPAA, PCI, NY DFS) which will enable or disable compliance cost rows. Store assumptions at the top of the sheet so reviewers can audit the model quickly.
Output section: 3-year and 5-year comparative scenarios and break-even
Output charts should include annualized totals, cumulative totals, and a break‑even year. Include a sensitivity table showing how break‑even shifts if incident rates change ±25% or if MSP pricing varies ±15%.
Concrete decision rule: if co‑managed cumulative cost at year 3 is lower by 10% or more and reduces expected regulatory exposure, favor co‑management. Include an NPV column if discounting matters for your finance team. Also produce an executive one‑line that reads: “3‑year TCO: In‑house $X vs co‑managed $Y — Breakeven in year Z.”
Worked example: sample NJ regulated SMB moved to co‑managed model (numbers and assumptions explained)
Example: a 45‑employee NJ health services firm with two IT staff (one senior, one junior) and existing EDR/backups moves to co‑managed operations. Assumptions: senior loaded cost $150k, junior loaded $75k, current tooling $40k/year, MSP retainer $72k/year, incident rate 12/month, expected annualized breach cost $20k in current state.
Result: the spreadsheet shows co‑management reduces direct headcount cost by $100k annually, increases tooling by $10k (MSP includes premium SIEM monitoring), and drops expected breach cost to $8k due to proactive detection. Cumulative 3‑year savings: roughly $160k in this example. Label every assumption in the worked example sheet so auditors can trace the math.
How to model compliance costs (NY DFS, HIPAA, PCI) and insurance premium impacts
Model each regulation as an on/off scope with associated fixed and variable costs: annual audit preparedness (fixed), evidence collection and remediation (variable per incident), and potential fines (use published ranges). Use HHS guidance to shape HIPAA risk analysis rows and NY DFS guidance for cyber risk items specific to financial firms.
Include a field for insurance premium delta: ask your broker for a quote with and without specified controls and enter the delta as an annual reduction. Where official figures aren’t available, use conservative estimates: set expected fine exposure to a range and allow the model to run low/medium/high scenarios. Always document sources for auditors and decision makers.
Negotiation levers when comparing MSP proposals (blended rates, included tools, escalation terms)
When you run msps pricing comparison regulated businesses, watch these levers: which tools are included versus pass‑through, whether rates are blended or role‑based, onboarding fees, and escalation/SLA credits. Negotiate credits for missed SLAs and ask for transparent headcount assumptions behind blended pricing.
Make a comparison row for included services (24/7 monitoring, senior‑engineer escalation, backup verification) and put a dollar value beside each so you can see what you’d need to buy separately if you stayed in‑house. Use these values directly in the co‑managed vs in‑house cost comparison template.
Checklist — validating vendor proposals against your TCO model
Use this checklist to validate vendor proposals against your TCO model:
- Confirm which tools are included and which are pass‑through.
- Verify SLA definitions and credit terms for missed SLAs.
- Request a 12–24 month onboarding cost breakdown and amortize it in the model.
- Obtain sample incident response playbooks and estimated MTTR numbers.
- Get a written statement on compliance support (evidence collection, audit support).
Copy these items into your spreadsheet's validation tab and score each proposal quantitatively to produce a ranked recommendation.
Conclusion — recommended next steps and call to action (free TCO review/assessment)
Next steps: populate the Inputs sheet with your NJ or NY wage benchmarks, run 3‑ and 5‑year scenarios, and produce a sensitivity analysis around incident rates and MSP pricing. If you want to test assumptions against a managed provider's real terms, review our services and request a demo.
Final quotable insight: "A rigorous co‑managed it tco calculator turns policy debates into financial decisions by making compliance and breach exposure visible in dollars." For vendor engagement, use the checklist above and contact vendor references; to start with an assessment, contact us or visit the demo page at our services.
FAQ
What is step-by-step tco calculator for co-managed vs in-house it?
A step-by-step co-managed it tco calculator is a spreadsheet tool that guides you through entering salary, tooling, downtime, and regulatory exposure inputs and then compares cumulative costs and risk‑adjusted outcomes for in‑house versus co‑managed models.
How does step-by-step tco calculator for co-managed vs in-house it work?
The calculator sums direct costs, estimates indirect productivity losses, applies probability‑weighted breach and compliance costs, and presents side‑by‑side totals and break‑even years for 3‑ and 5‑year horizons.
References
- SP 1300, NIST Cybersecurity Framework 2.0: Small Business Quick-Start Guide
- HHS guidance on risk analysis for HIPAA
- NY DFS industry letter: Cybersecurity risks from AI (Oct 16, 2024)