
Question: How do regulated SMBs in New Jersey and New York calculate an MSSP ROI using a practical, NJ/NY-aware approach?
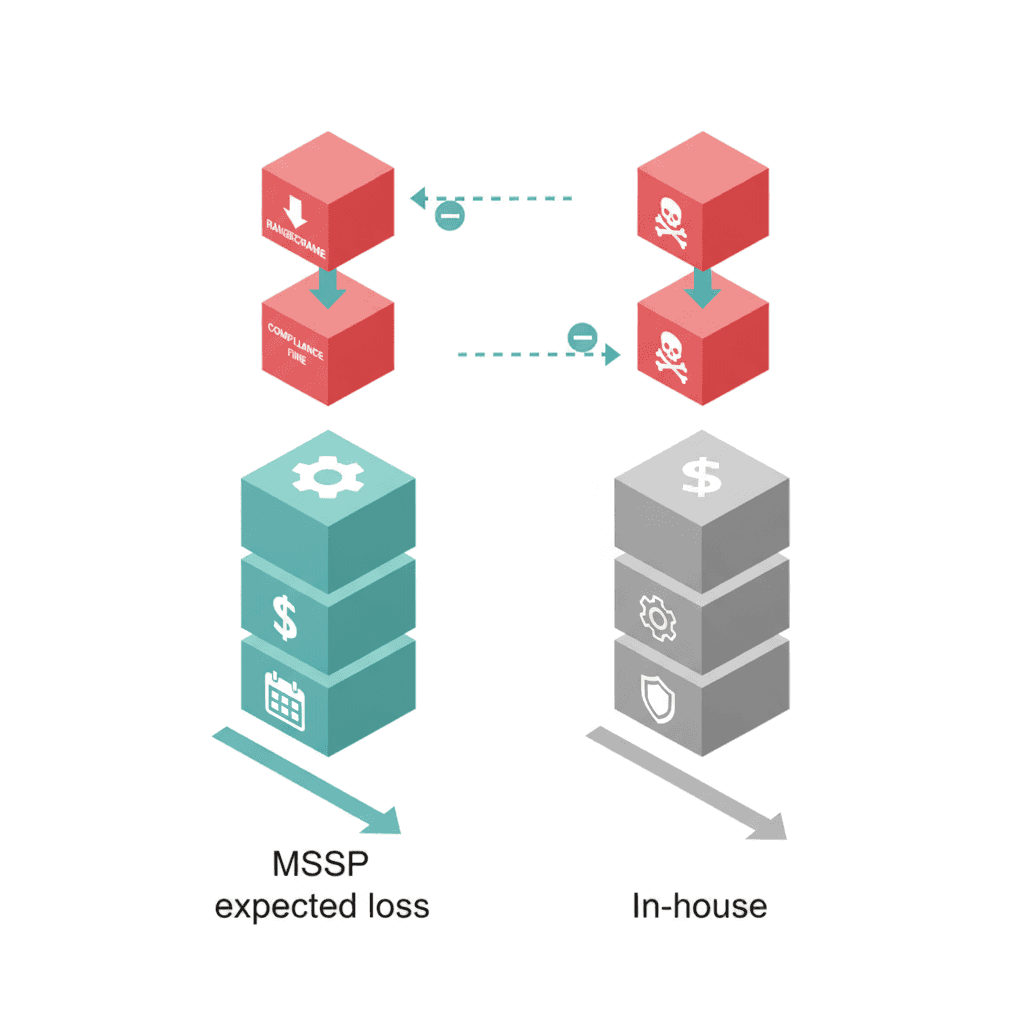
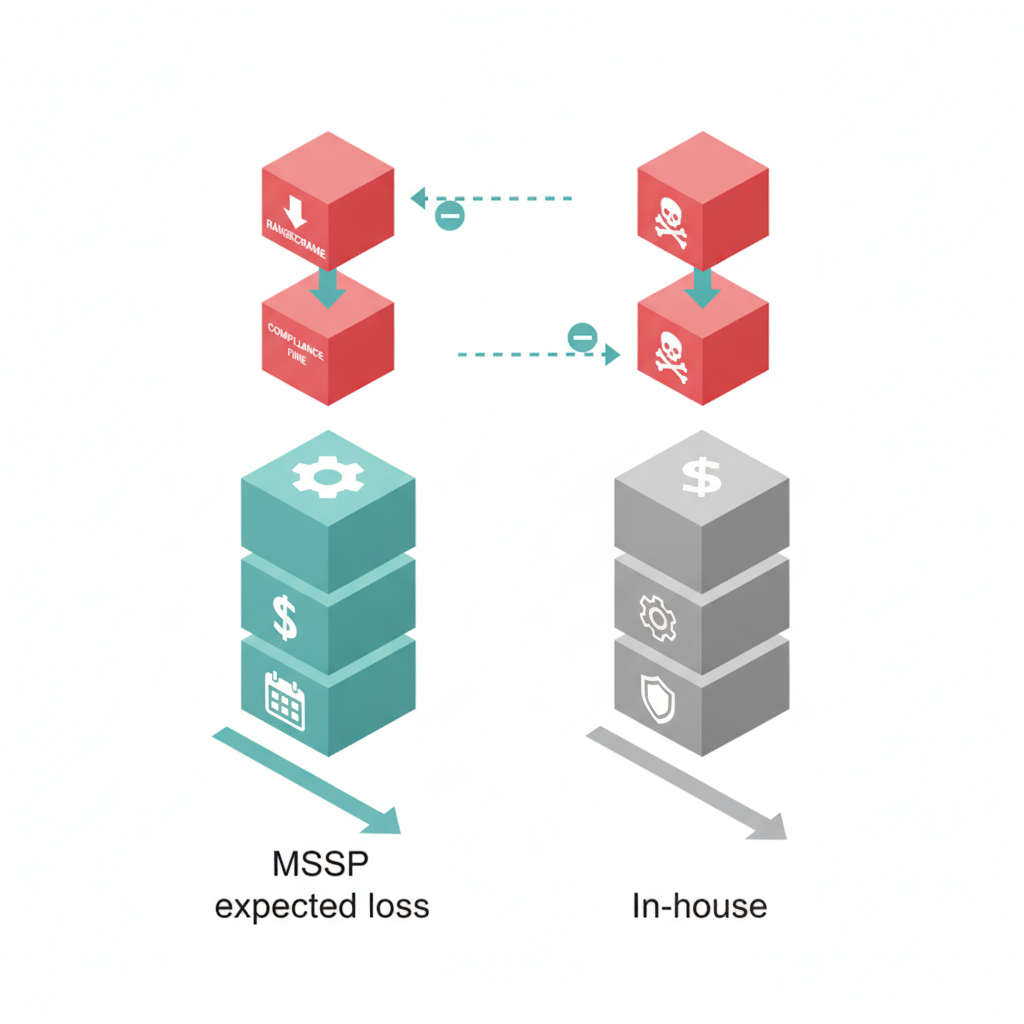
Answer: Use a probability-adjusted expected-loss model that compares baseline (pre-MSSP) expected annual loss to post-MSSP expected loss, then subtract MSSP annual cost. This produces a clear ROI and shows where savings come from: breach avoidance, compliance fines avoided, productivity preserved, and lower internal security overhead. For more on this, see Rfp mssp nj ny.
Start by gathering local regulatory inputs (HIPAA for healthcare, NYDFS guidance for financial services) and realistic incident costs for your environment. The quoted ROI formula for quick reference: 'Expected annual loss = probability of incident × average cost per incident; expected reduction = baseline loss − post-MSSP loss; ROI = (expected reduction − MSSP annual cost) / MSSP annual cost.' Keep this formula visible while you build the spreadsheet template described below.
Why ROI for MSSP matters for regulated SMBs in NJ & NY
Regulated small and mid-size businesses in New Jersey and New York face two concrete cost drivers: the direct cost of cyber incidents and the regulatory cost of non-compliance. For HIPAA-regulated practices in NJ, a breach that exposes ePHI triggers breach notification, remediation and potential OCR enforcement. For NY-based financial firms, NYDFS requirements and examinations raise the stakes for controls and reporting. Quantifying MSSP ROI turns hypothetical risk into budgetable savings.
One clear example: a 40-person medical practice in northern NJ might estimate a ransomware incident causing 5 days of downtime, third-party forensics, and remediation costs. A financial services firm in NYC may estimate higher regulatory penalties and audit remediation after a compromise. MSSP ROI lets both organizations compare the cost of managed security (subscription, implementation, internal oversight) to the expected avoided losses and compliance-effort savings.
Expected annual loss = probability × cost; reduce probability and cost, and ROI becomes measurable.

Framework for calculating MSSP TCO (subscription, implementation, internal oversight)
TCO for an MSSP covers recurring subscription fees, one-time implementation and integration, and ongoing internal oversight costs. Build a three-line cost model: annual subscription, first-year implementation amortized (divide one-time costs across 3 years), and internal staff time for coordination and audits. Include tool overlaps you can retire (for example, an aging EDR license) to credit savings against MSSP fees.
Sample line items to capture in your spreadsheet: MSSP annual subscription; SIEM ingest or log-storage surcharges if applicable; initial deployment professional services; internal security manager hours (FTE fraction × fully loaded rate); and replacement or consolidation credits (licenses you cancel). This yields a transparent tco mssp you can compare to a fully in-house alternative.
When you compare mssp cost vs in-house security, include hidden costs: recruiting and retaining senior security staff, overtime for incident response, training, and annual red-team or compliance assessment fees. For NJ & NY firms, add the cost to prepare for HIPAA or NYDFS exams as a recurring compliance burden your MSSP can reduce.
Quantifying avoided costs
Quantifying avoided costs converts incident scenarios into dollars. Break avoided costs into three buckets below: direct breach costs, regulatory fines/remediation, and productivity/opportunity losses. For each bucket, estimate baseline values (today's exposure) and post-MSSP values (reduced probability and/or impact). Use conservative probability reductions (for example, a 30–60% drop in successful ransomware events after mature monitoring and EDR).
Breach & ransomware direct costs (downtime, recovery, ransom, forensic fees)
Direct breach costs include ransom payments (if paid), forensic and legal fees, data recovery and replacement hardware, and extended incident response. Also include downtime costs: lost billings, halted operations, and third-party vendor fees. For a typical NJ SMB, estimate average cost per incident by adding forensic ($15k–$60k), recovery and restore labor ($10k–$40k), and downtime revenue loss (daily revenue × days offline).
For ransomware cost avoidance mssp calculations, model two scenarios: baseline incident probability × baseline cost, and post-MSSP probability × residual cost (smaller because containment and faster detection limit impact). The difference is the avoided direct cost attributed to MSSP controls and alerting.
Compliance fines and remediation (HIPAA and NYDFS penalty considerations)
Regulatory fines and remediation can swamp direct costs. HIPAA settlements often involve corrective action plans plus penalties tied to negligence; NYDFS levies fines and can require remediation after incidents involving financial institutions in New York. For a conservative estimate, include three elements: potential fines (based on guidance ranges), mandatory remediation and audit costs, and customer notification and credit monitoring expenses.
Model cost_of_non-compliance_nj_ny as a probability-weighted : probability of enforcement action × (fine + remediation + monitoring). MSSP services that produce audit-ready logs and faster incident containment reduce both the probability of enforcement and the scope of remediation, creating measurable savings.
Productivity and opportunity costs (employee downtime, lost revenue)
Lost productivity often equals the largest single unseen cost. Count employee-hours lost to outage, time IT spends on triage, and delayed projects. For example, a 100-employee firm with average loaded labor cost of $60/hr losing 8 hours each per incident incurs roughly $48,000 in productivity loss alone. Add sales impact if customer access is affected.
Include opportunity costs too: delayed launches, missed billing cycles, or lost competitive bids while systems are down. MSSP outcomes that cut detection time (MTTD) and response time (MTTR) reduce these losses and should be recorded as recurring annual savings in your ROI spreadsheet.
Cutting average downtime from 72 to 24 hours converts into direct revenue preservation and a clear ROI line item.
Probability-adjusted risk reduction — modeling expected loss before/after MSSP
Translate scenarios into expected loss numbers. Use the formula provided earlier. Example steps: list incident types (ransomware, data breach, insider loss), assign a baseline annual probability to each (e.g., 0.2 for one medium incident every five years = 20% annual probability), and estimate cost per incident. Multiply and sum to get baseline expected annual loss. Next, apply MSSP effectiveness assumptions — lower probability and/or lower cost per incident — to compute post-MSSP expected loss.
Quotable calculation: 'Expected annual loss = probability of incident × average cost per incident.' Use conservative reductions — 30% probability reduction and 40% cost reduction are defensible starting points — then stress-test the model with sensitivity analysis (P10/P90). This shows leadership how ROI changes when MSSP impact assumptions shift.
Compliance-cost savings and audit-efficiency gains
MSSPs can reduce the hours and expense required to support audits and regulatory exams. Savings come from centralized logging, standardized controls mapped to NIST CSF, and repeatable evidence packages. For NYDFS and HIPAA, estimate hours saved for internal staff and external consultants per audit and multiply by loaded hourly rates. Add avoided rework and fewer findings, which translate into lower remediation costs.
Document two artifacts here: a controls-to-framework checklist and an evidence-runbook for audits — both reduce auditor billable time. These become recurring annual savings and are a defensible part of tco mssp calculations for regulated NJ & NY SMBs.
Building a simple ROI calculator (inputs, formulas, downloadable spreadsheet template)
Build a single-sheet spreadsheet with these inputs: annual MSSP subscription, one-time implementation, internal oversight FTE fraction (hours × fully loaded rate), baseline incident probabilities and costs by incident type, expected MSSP effectiveness (probability reduction %, impact reduction %), and audit hours saved. Use the quotable ROI formula: Expected annual loss = probability × cost; expected reduction = baseline − post-MSSP; ROI = (expected reduction − MSSP annual cost) / MSSP annual cost.
Include a sensitivity table and a before/after comparison table. Provide a downloadable spreadsheet template and sample inputs for NJ/NY verticals (healthcare: HIPAA; finance: NYDFS). Example inputs and a short checklist are below.
- Checklist: 1) Confirm baseline incident history; 2) Gather loaded labor rates; 3) Estimate regulatory remediation costs; 4) Enter MSSP quote and implementation fees; 5) Run sensitivity at ±20%.
| Metric | Before MSSP | After MSSP |
|---|---|---|
| Expected annual loss | $120,000 | $45,000 |
| MSSP annual cost | — | $60,000 |
| Net annual benefit | — | $15,000 |
Examples: 3 sample scenarios for small, mid, and larger regulated SMBs
Small (10–25 employees, NJ medical practice): Baseline expected annual loss $60k (probability 15%, cost per incident $400k scaled by exposure). MSSP annual cost $18k; post-MSSP expected loss $20k. Net benefit: $22k first-year (after amortized setup). Mid (50–150 employees, NY-based finance firm): Baseline expected annual loss $220k due to higher audit risk; MSSP cost $75k; post-MSSP expected loss $80k; net benefit $65k. Larger regulated SMB (150–400 employees): Baseline expected annual loss $450k; MSSP cost $180k; post-MSSP expected loss $150k; net benefit $120k.
These examples are templates — replace probabilities, local remediation price quotes, and internal rates with your data. The downloadable spreadsheet includes these scenarios so you can swap inputs quickly.
How to present ROI to leadership and procurement (one-page executive summary template)
One-page executive summary structure: 1) headline ROI number (percentage and net annual benefit), 2) one-line summary of methodology (probability-adjusted expected-loss model), 3) top three cost drivers reduced (ransomware, compliance fines, productivity loss), 4) TCO breakdown (subscription, implementation, internal oversight), 5) three recommended next steps (pilot, contract term, KPIs). Put the quotable ROI formula in the methodology box for transparency.
Use a small table showing before/after expected annual loss and a short sensitivity row (best/worst case). Leadership reacts to clear dollar-and-risk statements; procurement wants TCO and contract terms. This template keeps both satisfied and speeds approval.
Next steps: pilot scope, measurement timeline (30/60/90 day KPIs)
Pilot scope: 30–90 day proof for a single business unit or location. Track KPIs: alerts triaged, mean time to detect (MTTD), mean time to respond (MTTR), number of high-severity incidents averted, and audit evidence preparation hours saved. Suggested targets: reduce MTTD by 50% and MTTR by 30% in 90 days, and document one avoided incident or accelerated containment event.
Measurement timeline: 30 days — baseline data collection and onboarding; 60 days — initial tuning and first incident-response drills; 90 days — full reporting and quantified expected-loss delta. Use the results to populate the ROI spreadsheet and present the one-page executive summary to leadership.
To explore a pilot scoped for NJ or NY regulated environments, review our services and request a demo at our services. For direct contact, use the company contact pages: contact us, contact us, or contact us.
Show ROI as expected-loss reduction minus MSSP cost; numbers win approvals, not adjectives.
FAQ
What is calculating mssp roi for regulated nj & ny smbs? Calculating MSSP ROI for regulated NJ & NY SMBs is the process of comparing the probability-weighted expected annual loss before an MSSP to the expected loss after MSSP deployment, then subtracting MSSP costs to show net savings and percentage return (use the provided ROI formula).
How does calculating mssp roi for regulated nj & ny smbs work? The calculation works by listing incident types, assigning baseline probabilities and costs, estimating MSSP effectiveness (probability and impact reduction), computing baseline and post-MSSP expected losses, and comparing those savings against MSSP total cost to produce an ROI and sensitivity analysis.